01F_RSC
Critical Structural Redundancy Factor
A new metric quantifying how much reserve capacity a transmission tower retains beyond first-member failure — proposed and validated through pushover and nonlinear analysis.
Doctoral thesis — Technical University of Cluj-Napoca, Faculty of Civil Engineering, 2021. Supervisor: Prof. Dr. Eng. Zoltán Kiss.
Doctoral thesis defended at the Faculty of Civil Engineering, Technical University of Cluj-Napoca. Supervisor: Prof. Dr. Eng. Zoltán Kiss.
2021
Defended
UTCN
Cluj-Napoca
LEA
Domain
Romania's high-voltage network was largely designed in the 1960s–1980s, under codes that no longer represent current wind, ice and reliability requirements. Standards have changed up to six times over the service life of these structures.
At the same time, joint stiffness, bolt preload, corrosion loss of section and failure-mode hierarchy were rarely captured in the original design models — leading to opaque, hard-to-rehabilitate assets.
Four contributions to the standard of practice
A new metric quantifying how much reserve capacity a transmission tower retains beyond first-member failure — proposed and validated through pushover and nonlinear analysis.
Quantified the effect of bolted-connection stiffness on the global capacity of lattice towers. Showed that connection assumptions can shift capacity by tens of percent.
Pushover analyses across multiple tower heights (25.7 m / 28.7 m / 34.7 m) and wind directions, mapping the most critical load configurations.
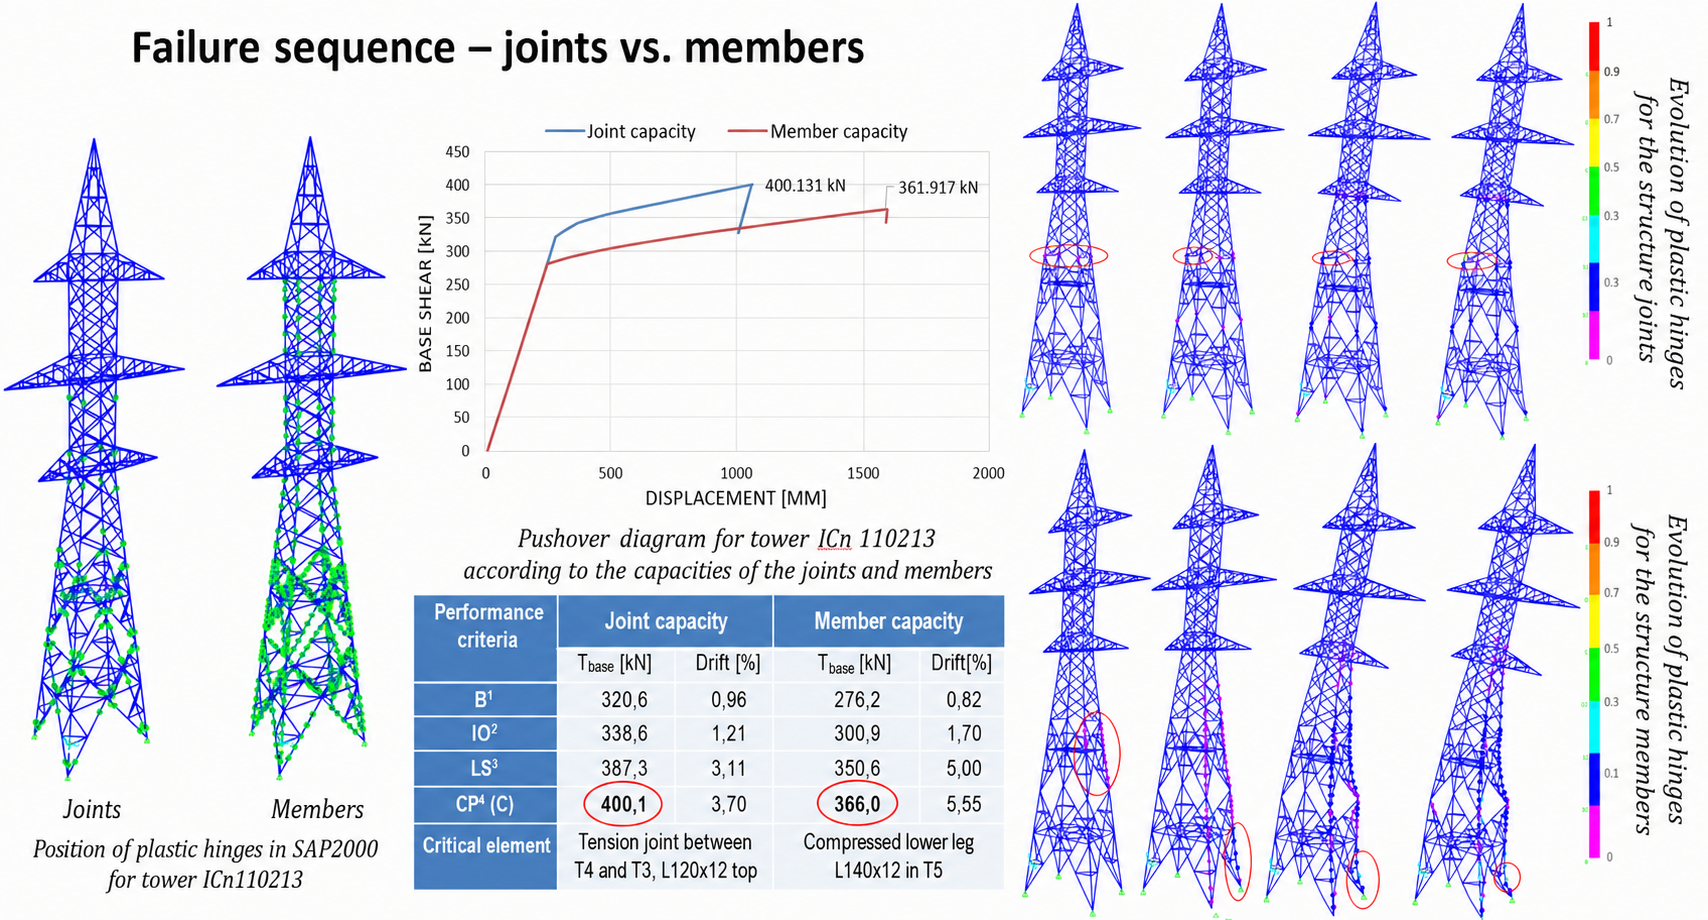
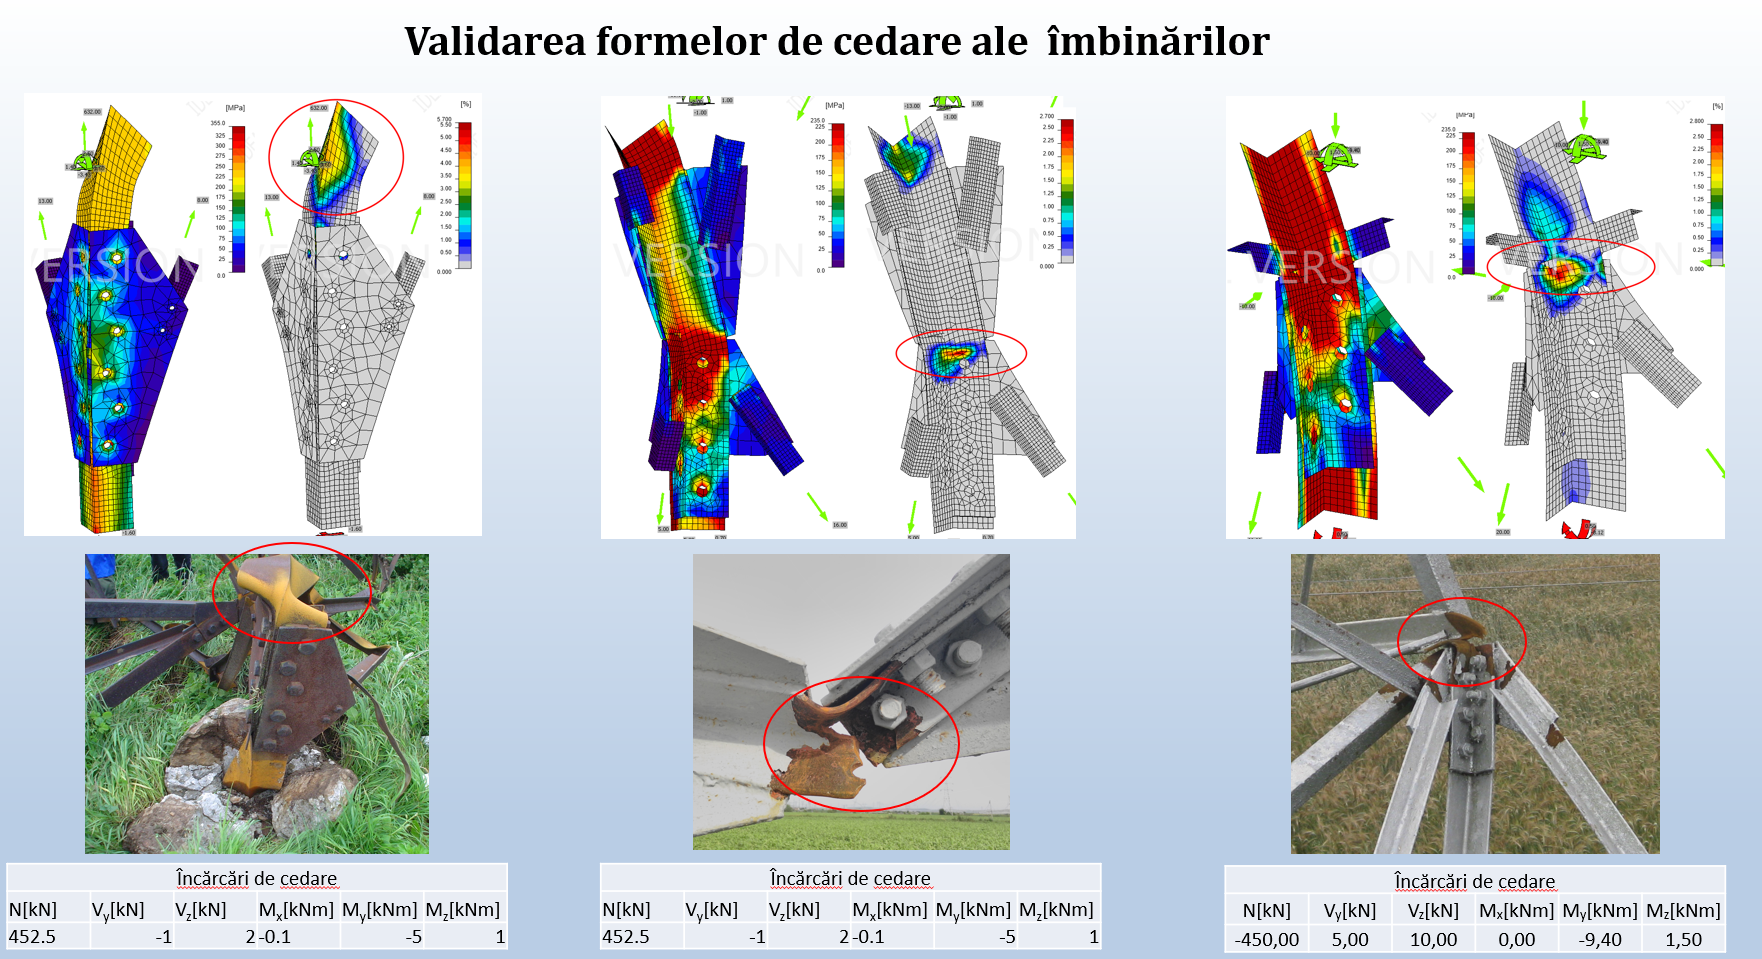
Identified and validated collapse mechanisms for ICn 110/213-type towers using SAP2000 pushover, dynamic nonlinear and field-observed failures.
An independent, representative research effort mapping collapses, partial failures and critical damages of high-voltage lattice towers in service. The study cross-references the age of the network with the geographic distribution of recorded failures, exposing where the grid is structurally most exposed.
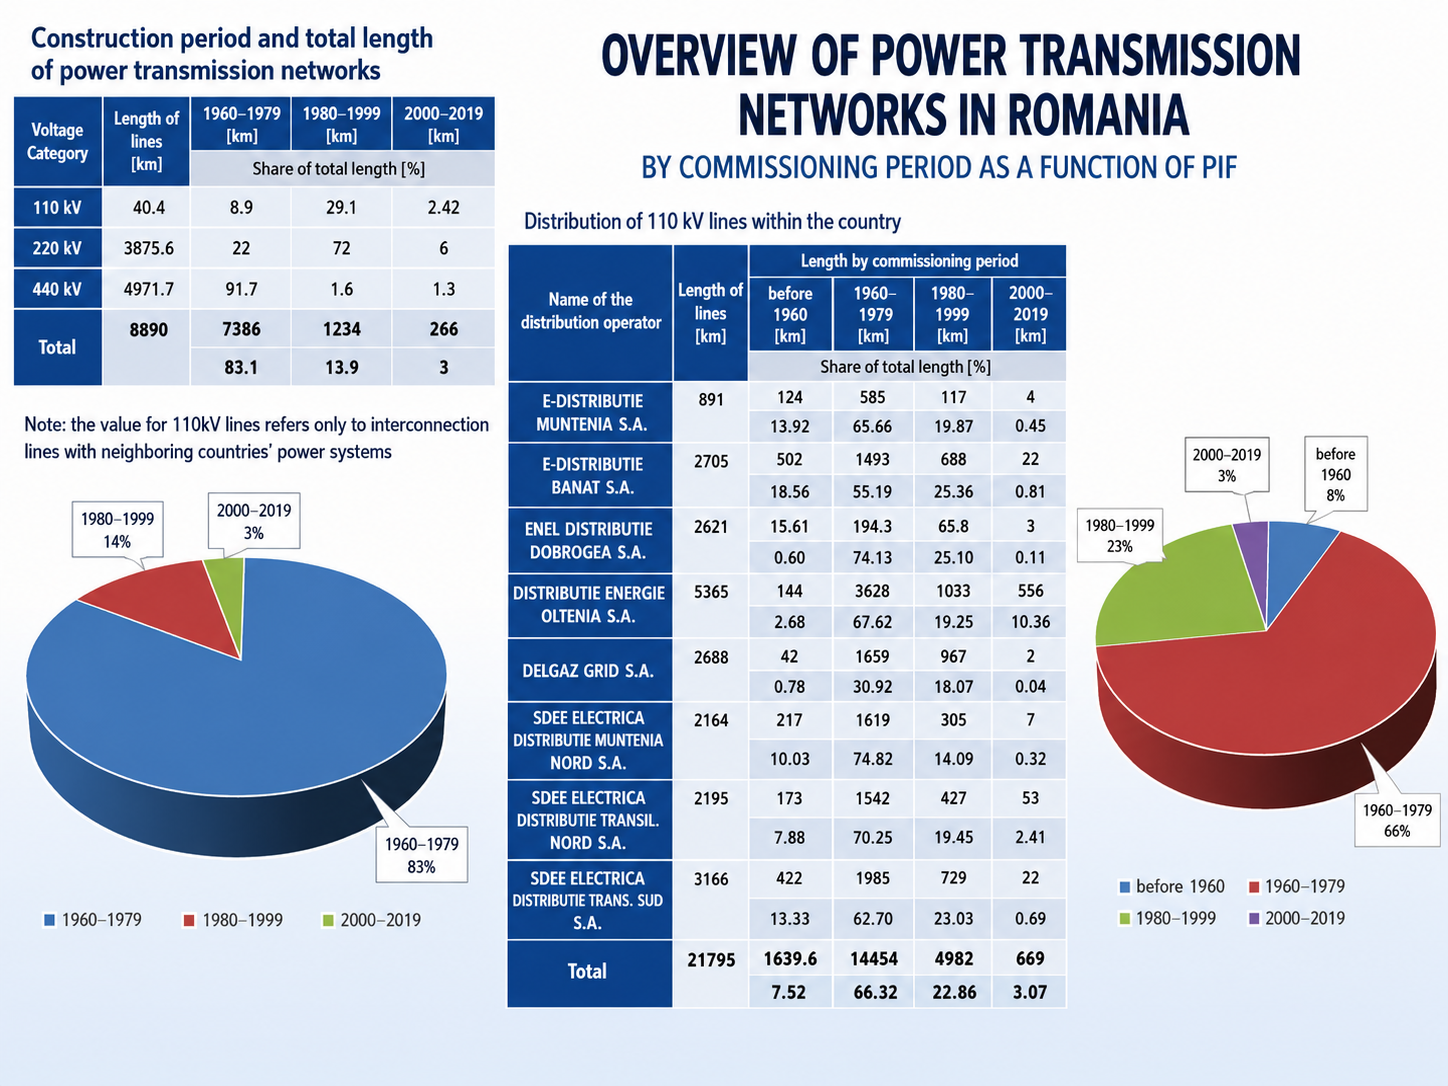
Construction-decade mapping of the Romanian transmission network. Most lines still in operation were energised between the 1960s and 1980s — the same population that dominates the failure pattern shown below.
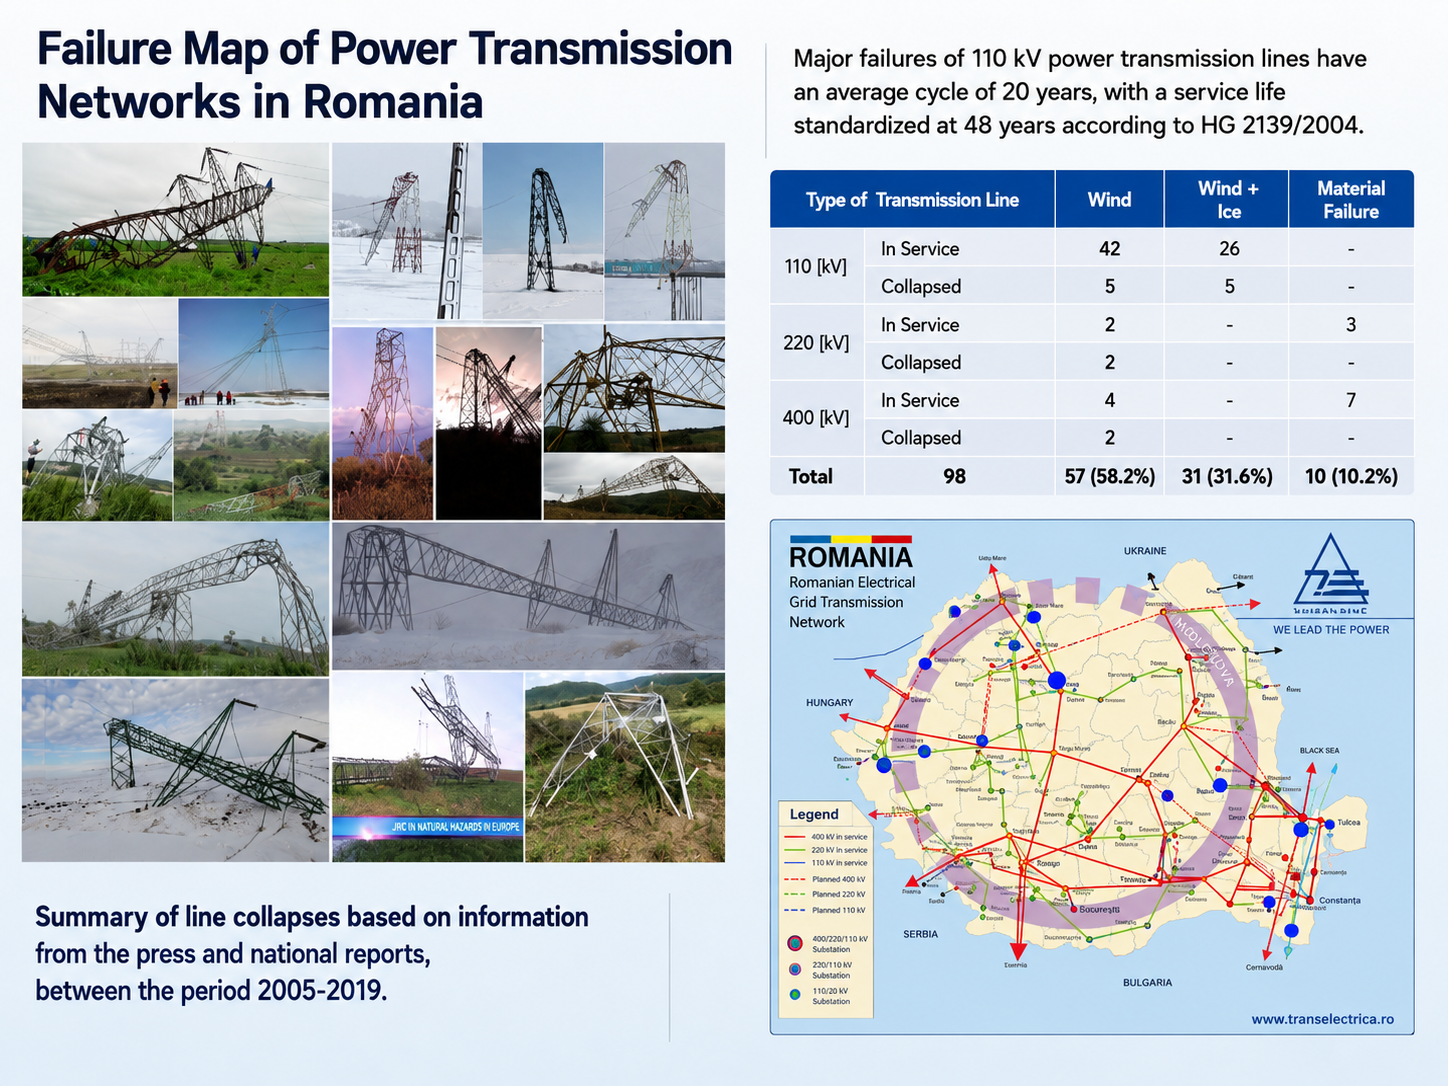
Geographic distribution of documented tower failures, collapses and damage events. The clustering follows exposed wind corridors and ice-prone regions — a structural fingerprint of where the grid is most vulnerable.
Numerical models were not trusted in isolation. Every analytical result was cross-checked against laboratory testing on recovered material and field measurement of in-service structures.
Parametric model generation in Grasshopper, FE analysis in SAP 2000 v21 and Consteel — linear, geometric-nonlinear and material-nonlinear runs.
Tensile testing on plates cut from failed towers and on recovered bolts on the INSTRON 8801. Mechanical characterisation of 1968-era steel still in service.
Laser scanning of in-service towers, point-cloud comparison with as-built models, on-site corrosion mapping and geometric deviation surveys.
Dog-bone specimens and recovered bolts from two in-service lattice towers were tested on the INSTRON 8801 to characterise the steel actually carrying the grid today.
1975
Original specification, 50+ years in service
1990
Later generation, post-revision steels
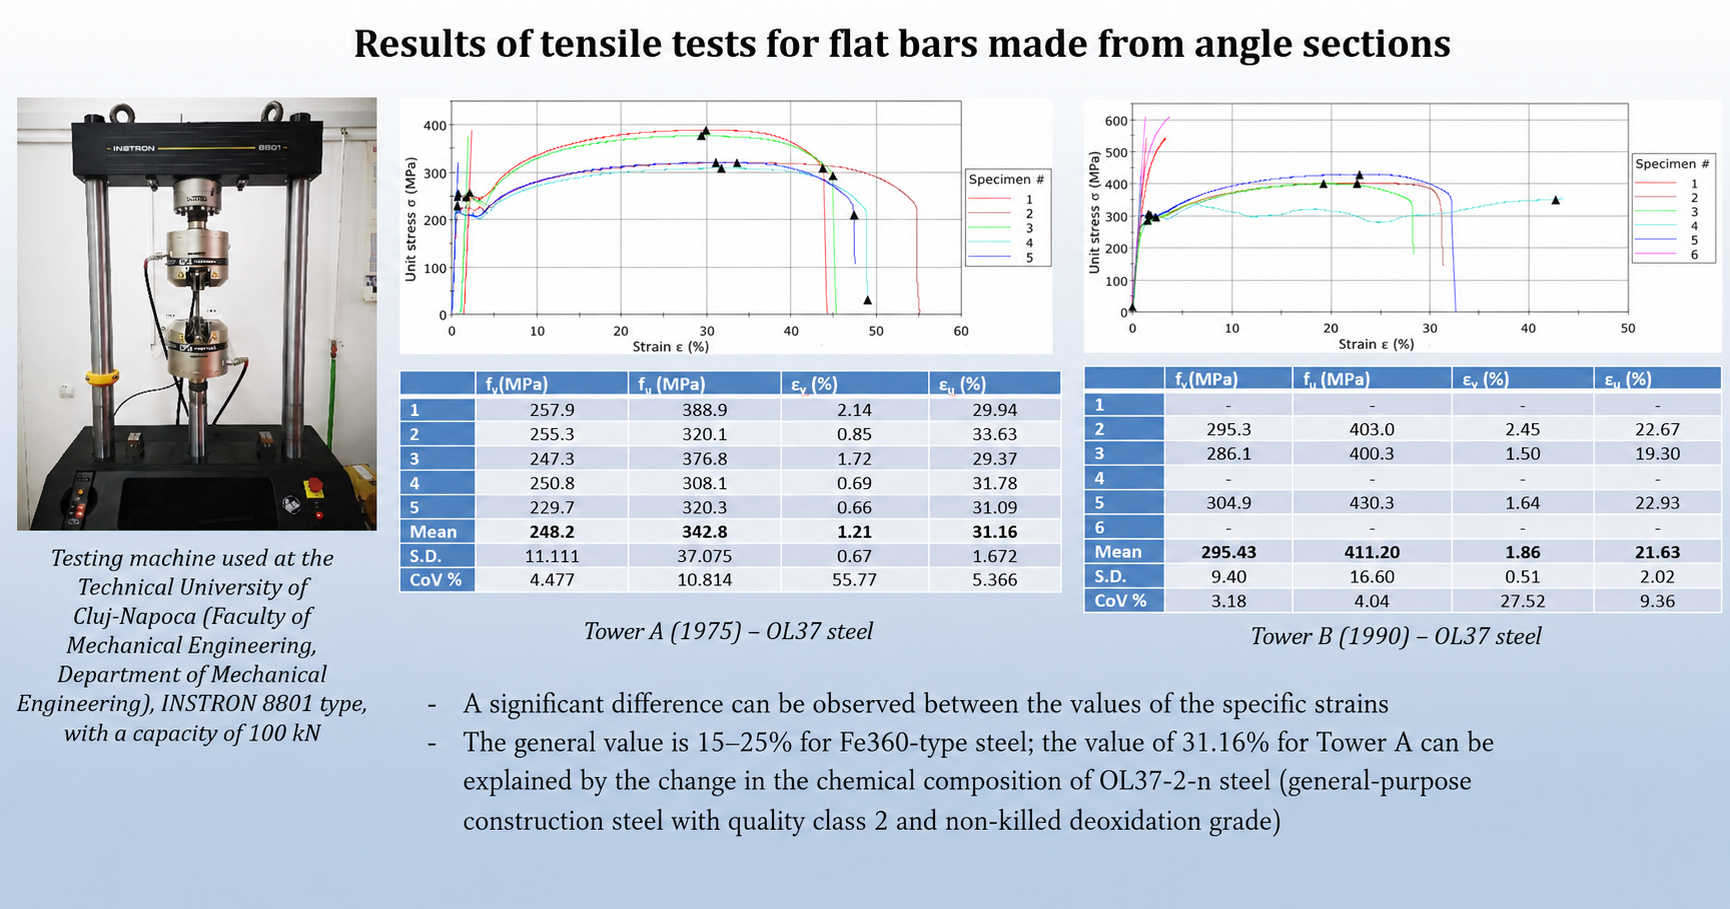
Stress–strain curves for dog-bone specimens cut from main angle members of Tower A (1975) and Tower B (1990). Yield, ultimate and elongation values establish the real steel grade still resisting wind and ice loads today.
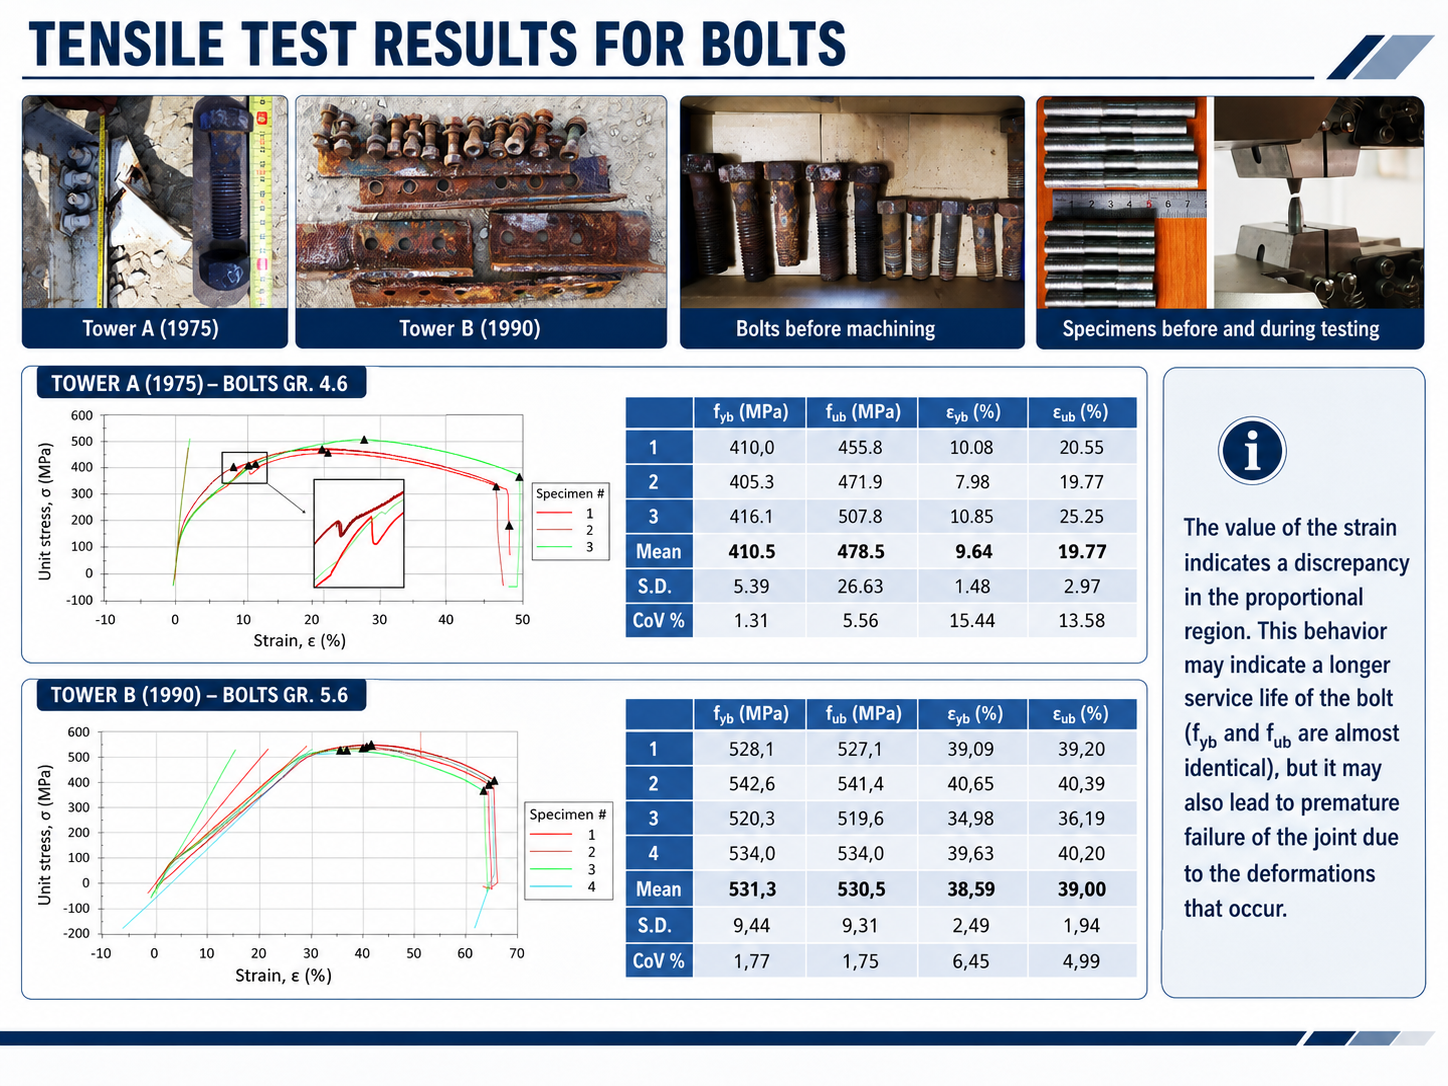
Recovered bolts from the same towers tested to failure. The comparison between the 1975 and 1990 batches reveals how fastener grades evolved and quantifies the residual capacity of preloaded bolted nodes.
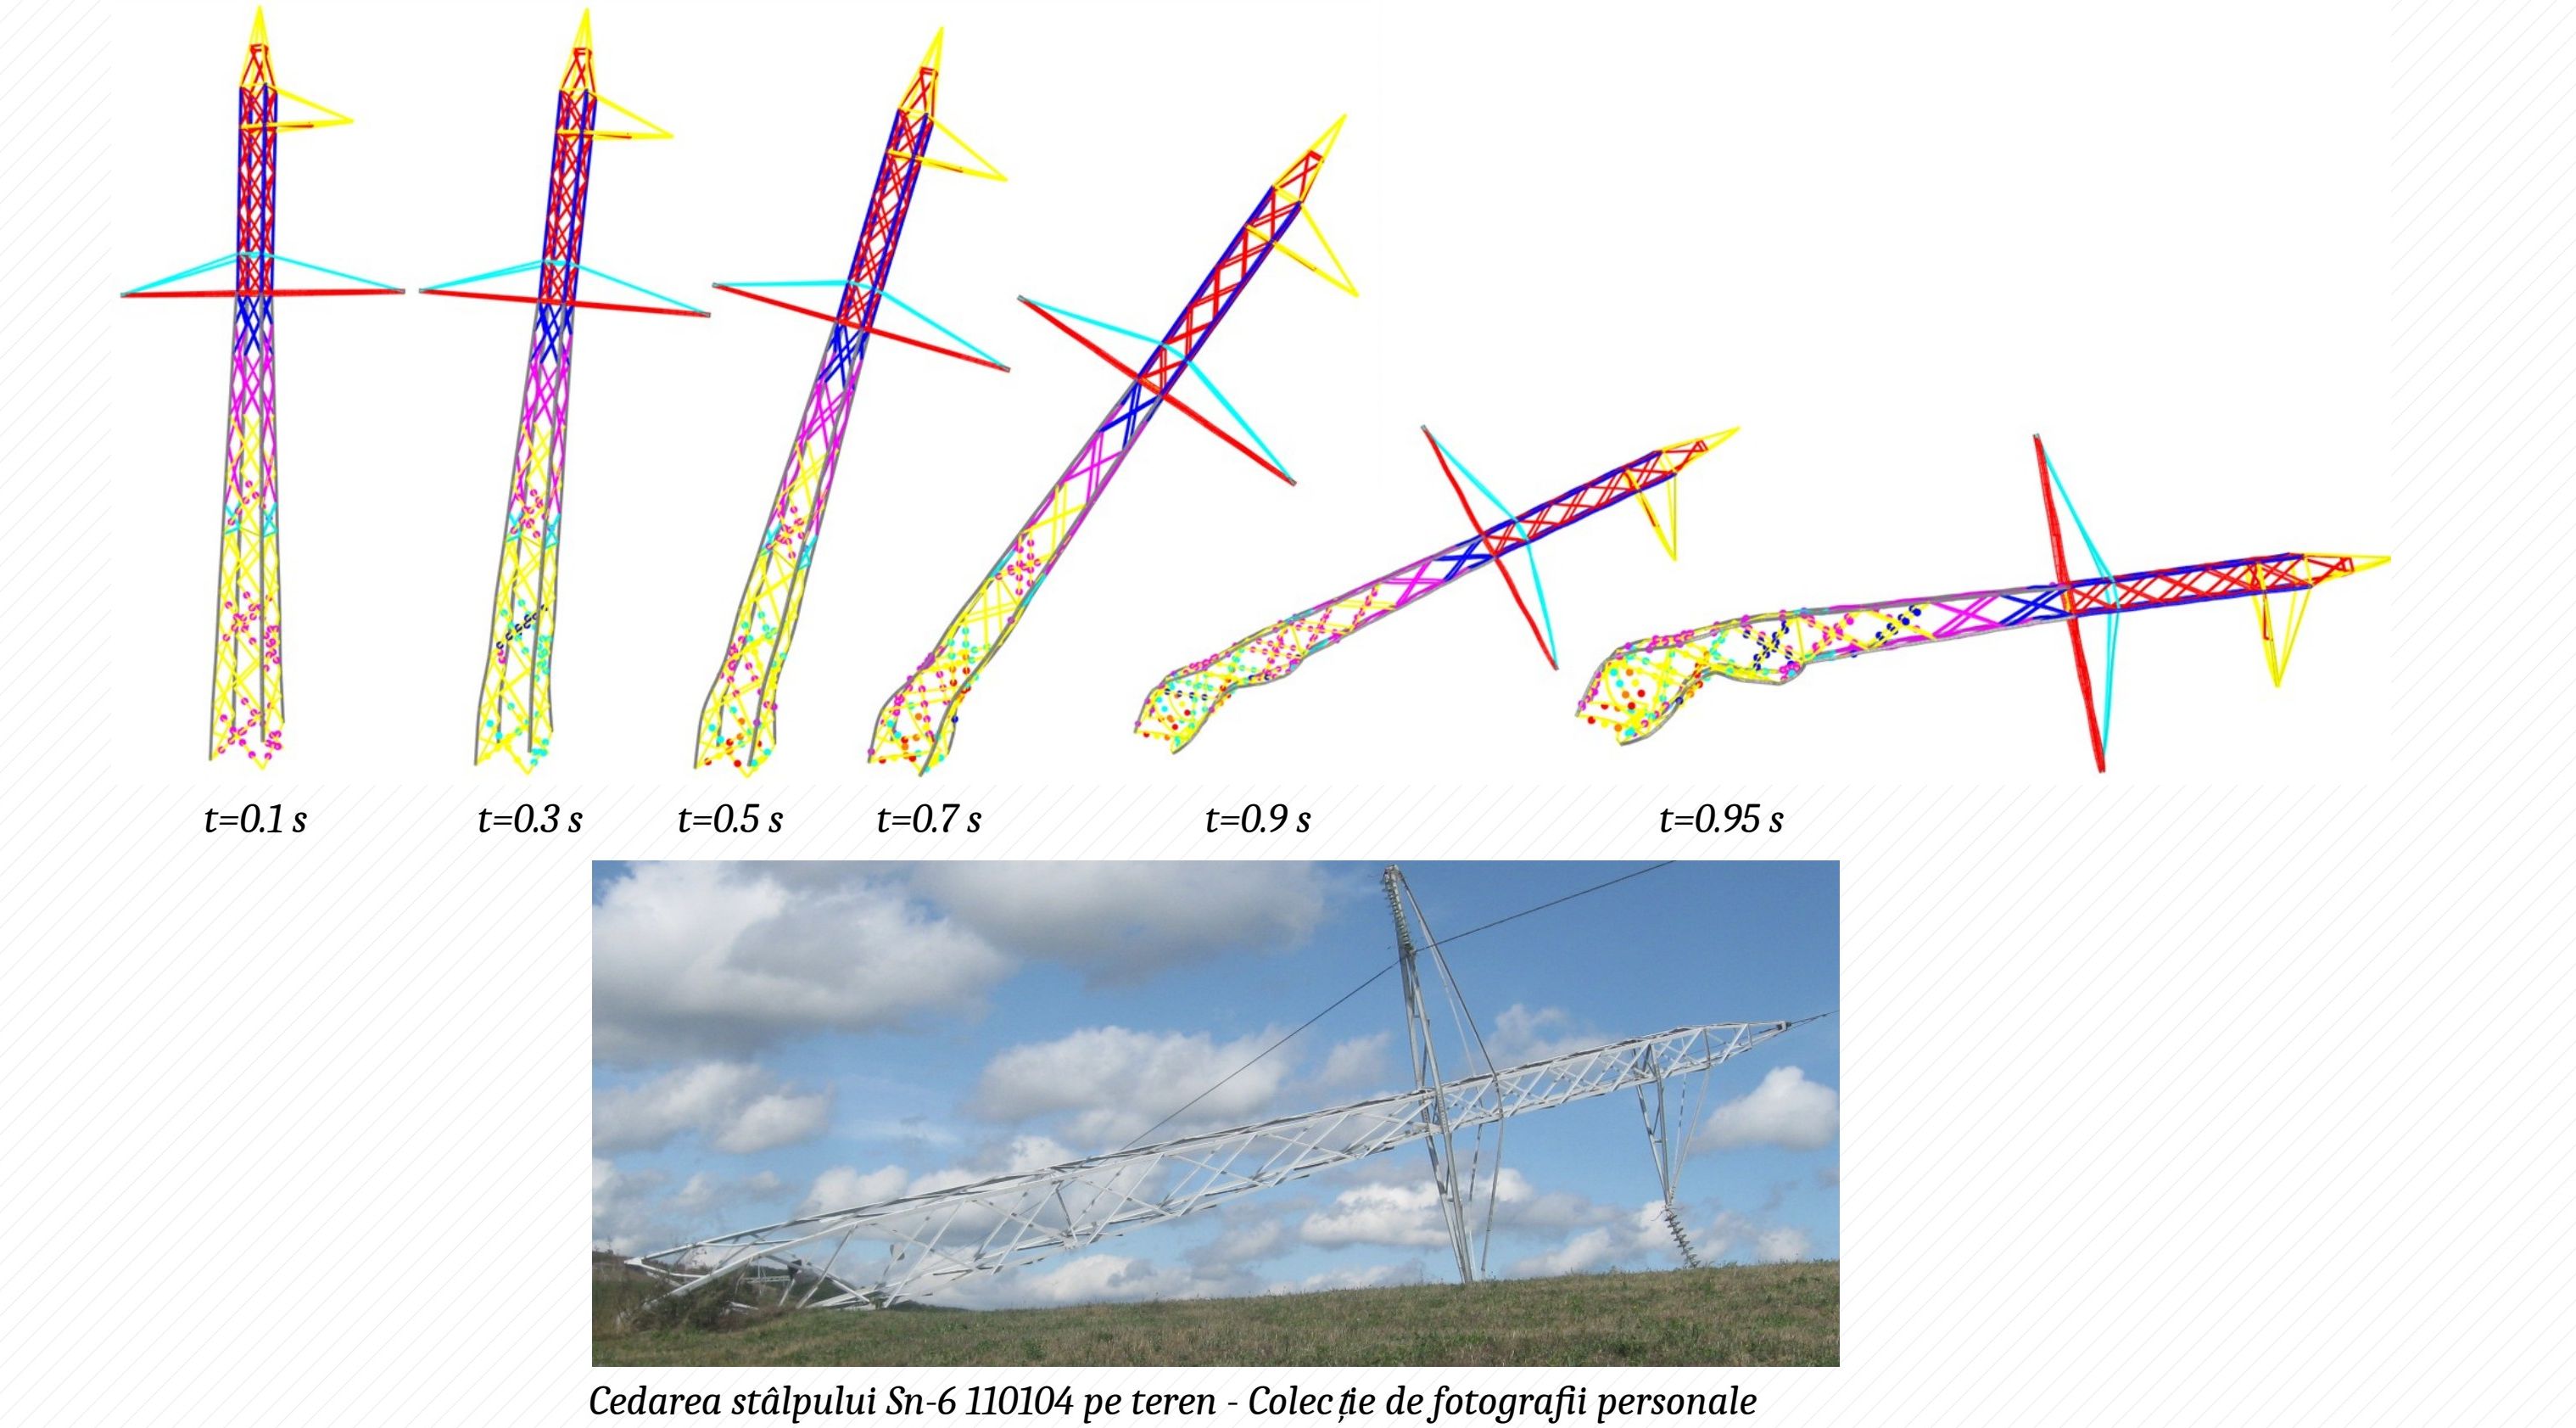
Dynamic nonlinear analysis of an ICn-3 110/213 tower under broken-wire and ice loading — the full sequence from intact to collapsed in under one second.
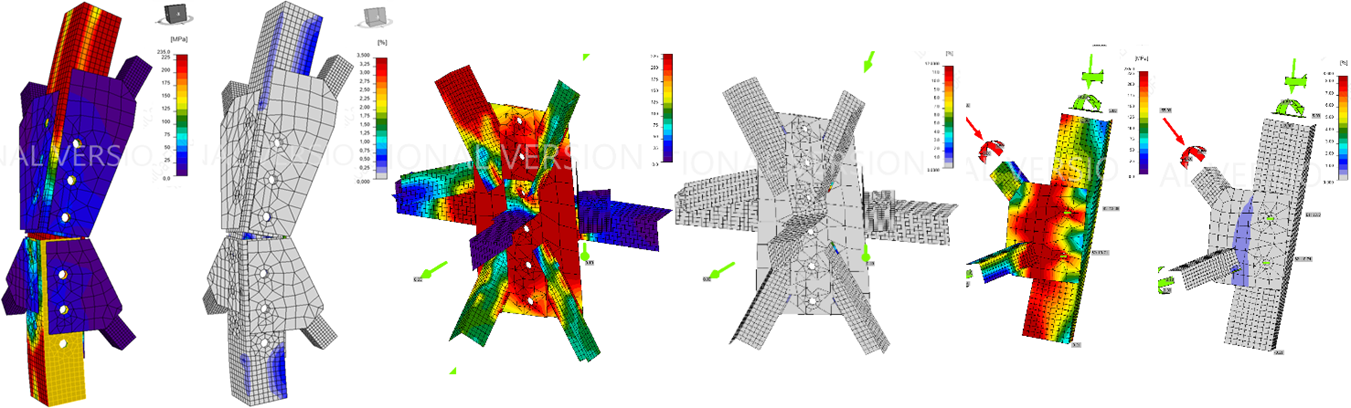
All bolted joint typologies of the ICn 110/213 tension tower were analysed in IDEA StatiCa using the CBFEM method. The results confirmed semi-rigid behaviour for every analysed node, and the ultimate capacity was determined per joint. Joint stiffness is therefore a design variable — not an assumption — and must enter the global model directly.
Detailed stress–strain field for joint J2. Plastic strain concentrates at bolt holes and weld toes, mirroring the locations where in-service failures are observed. Quantifying this semi-rigid response is the basis for an honest pushover capacity of the full tower.
Building on the parametric Grasshopper pipeline from the thesis, the next phase explores machine-learning-assisted screening of large tower portfolios — predicting capacity, failure mode and rehabilitation priority directly from geometry, age and field-survey inputs.